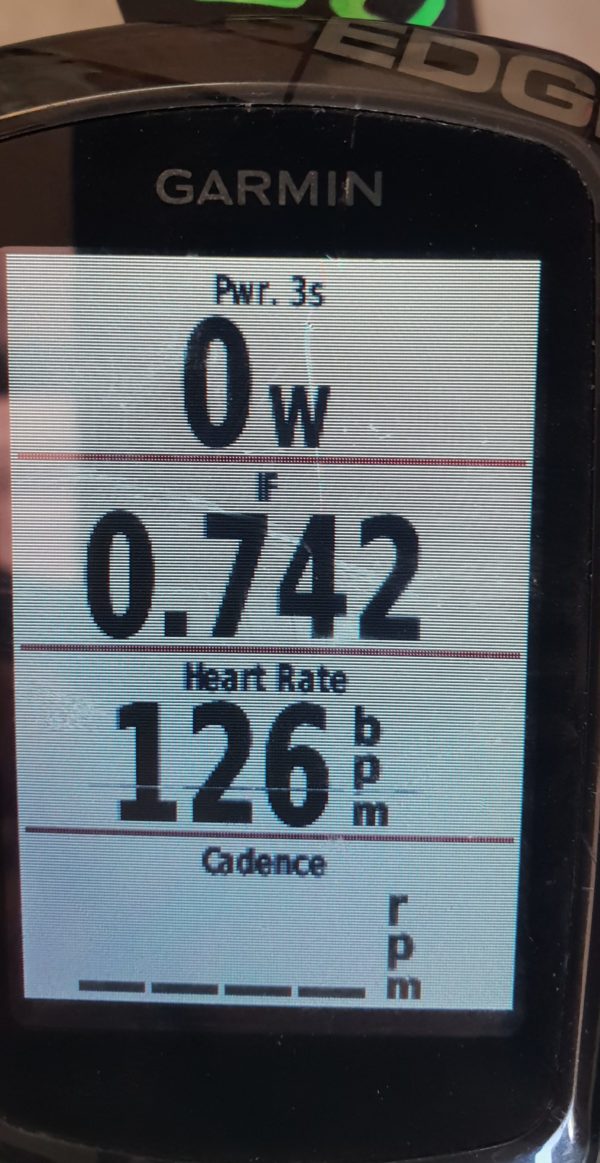
This one is for those riding to power, specifically racing to power. The secret is to focus on the process, not the outcome. To do this we need the numbers for the moment we are in, our physiological inputs and outputs.
Many set-up their Garmin to show speed, distance and time, metrics that re-enforce outcome targets, not process.
With power and heart rate metrics we have the capability to focus on process.
My recommended setup is to show 4 metrics on the main screen, and optionally some others on a second screen.
The primary screen I show Power 3 second average, Intensity Factor, Heart Rate and Cadence.
Power – 3 second average: The power reading jumps up and down and is hard to monitor, to judge intensity I prefer to monitor Intensity Factor. The power is useful, however, to monitor power cap and minimums. The power lets me know if I am pushing too hard on a climb and into headwind or too soft heading down wind and down a gradient. In an IRAONMAN my cap is 230 maximum and a minimum of 130 watts, I keep within these unless the hill is extreme.
Intensity Factor: The IF shows the average intensity factor over the course of the ride. My target over an IRONMAN is 0.72, in a 70.3 it is 0.85. This is individual, however the general range to allow for a good run is in a range of 0.70 to 0.75 where 0.70 for a 6 hour ride and 0.75 for a 5:10 ride. The IF allows me to adjust intensity without constantly monitoring power, and adjusting to periods of over power (early hills) and under investment (tail winds).
Heart Rate: Heart rate is the input which should also be monitored. Generally I ride to power (IF and Power 3s) but I monitor Heart Rate which will react to other stresses like heat, humidity, GI issues or unforeseen illness. Essentially if the HR shoots up well above aerobic for IRONMAN, or into Zone 4 for 70.3, I slow down regardless of power.
Cadence: Cadence is good to monitor as it can be an early indicator of fatigue. If it drops unexpectedly then it may be an indication you need to fuel up or back off.
On my second screen, just in case I get inquisitive, I have distance, time and Normalised Power. I rarely look at these.
What I don’t have displayed or available anywhere is Speed. Speed is the outcome of power, gravity and headwind. Not worth monitoring as it could make you invest effort badly. For example at IRONMAN New Zealand last year I averaged 40 km per hour for the 15 km section heading out of Taupo. Had I seen the speed I would have doubted myself and backed off. The section was slightly downhill and had a tailwind. I recall having to concentrate to keep my power up to 140 watt, 15 watts below my NP target,
because it felt fast. Speed is irrelevant, inputs and outputs are what counts.
